BNU AQI Dashboard

Indoor air quality across Beaconhouse National University

Average Score
0.0
Bad
Lowest Score
0.0
Single lowest reading
Highest Score
0.0
Single highest reading
Peak hour
—
Highest average air quality score

Air Quality Score through

Daily average ·

No readings for this selection.

Air Quality Score by time of day

Average across every day in the month; the peak hour is highlighted

No readings for this selection.

Air quality score bands

Share of readings in each band

No readings for this selection.

The sensor score runs 0 to 100 and rises as conditions improve, so a higher share in the upper bands is better.

Pollutants through the month

Each pollutant on its own scale — they are measured in different units and do not sum

No readings for this selection.

Air Quality Score by weekday and hour

Stronger colour means a higher average; blank cells were never sampled

No readings for this selection.

PM2.5 against PM10

0 sampled readings

No readings for this selection.

About Sensors & Data Collection

Awair sensors logging at five-minute intervals

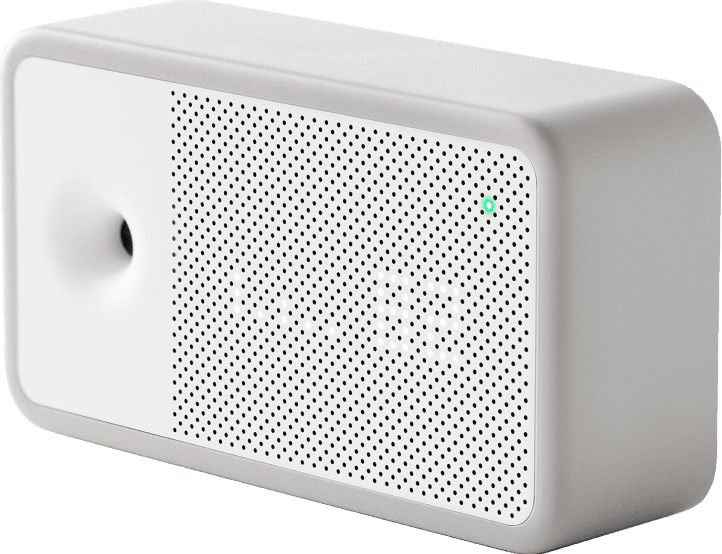
Our ground-based sensor network is strategically deployed across selected indoor spaces at BNU to capture real-world indoor environmental conditions. Sensors are placed across different rooms and building settings, including spaces with and without indoor plants, allowing us to compare air-quality conditions and assess how plant-based interventions perform under different indoor environments. The deployment provides continuous, location-specific measurements that capture variations across spaces and over time. These ground observations also provide a reliable basis for evaluating environmental conditions alongside building, occupancy, and ventilation characteristics.

An Awair air quality sensor of the type deployed across campus

Why PM2.5 matters

Share of global deaths from each condition attributable to PM2.5 exposure

Approximate share of global deaths from each condition attributed to fine particulate exposure.

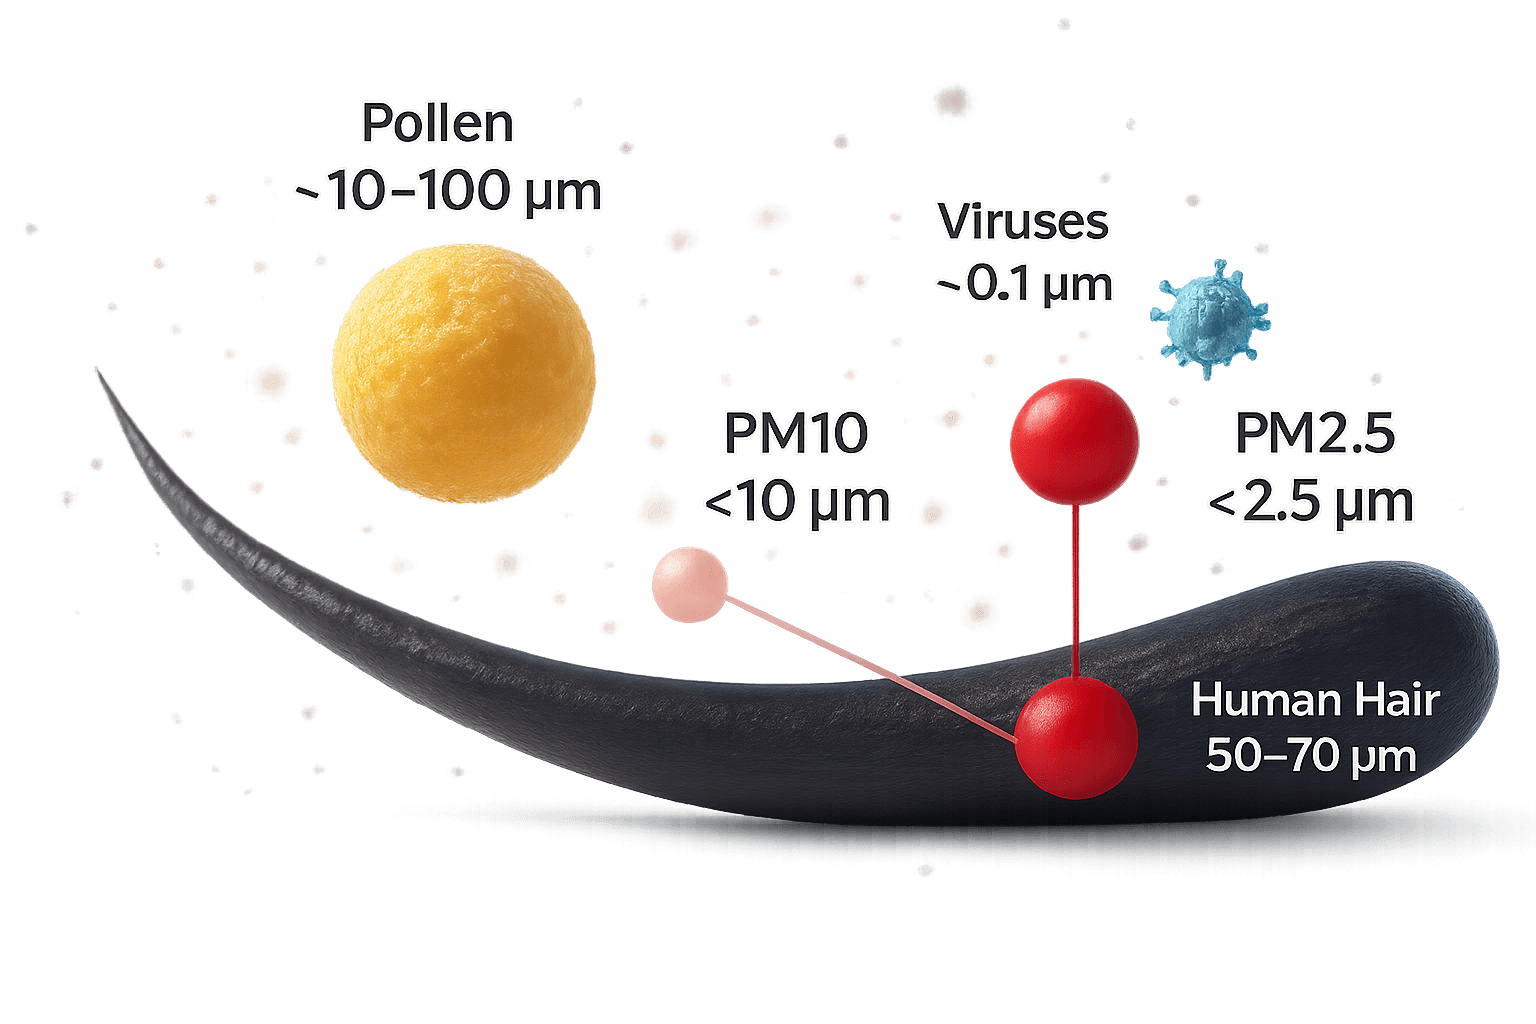
PM2.5 describes particles 2.5 micrometres across or smaller — roughly thirty times finer than a human hair. They pass the body's natural filters, settle deep in the lungs and cross into the bloodstream, which is why a single pollutant shows up behind such different diseases.

Diagram comparing the size of PM2.5 particles with a human hair and a grain of sand

The plants used in the planted rooms

Selected for tolerance of low indoor light and for their filtering behaviour

Aloe Vera

Aloe Vera

Aloe barbadensis miller

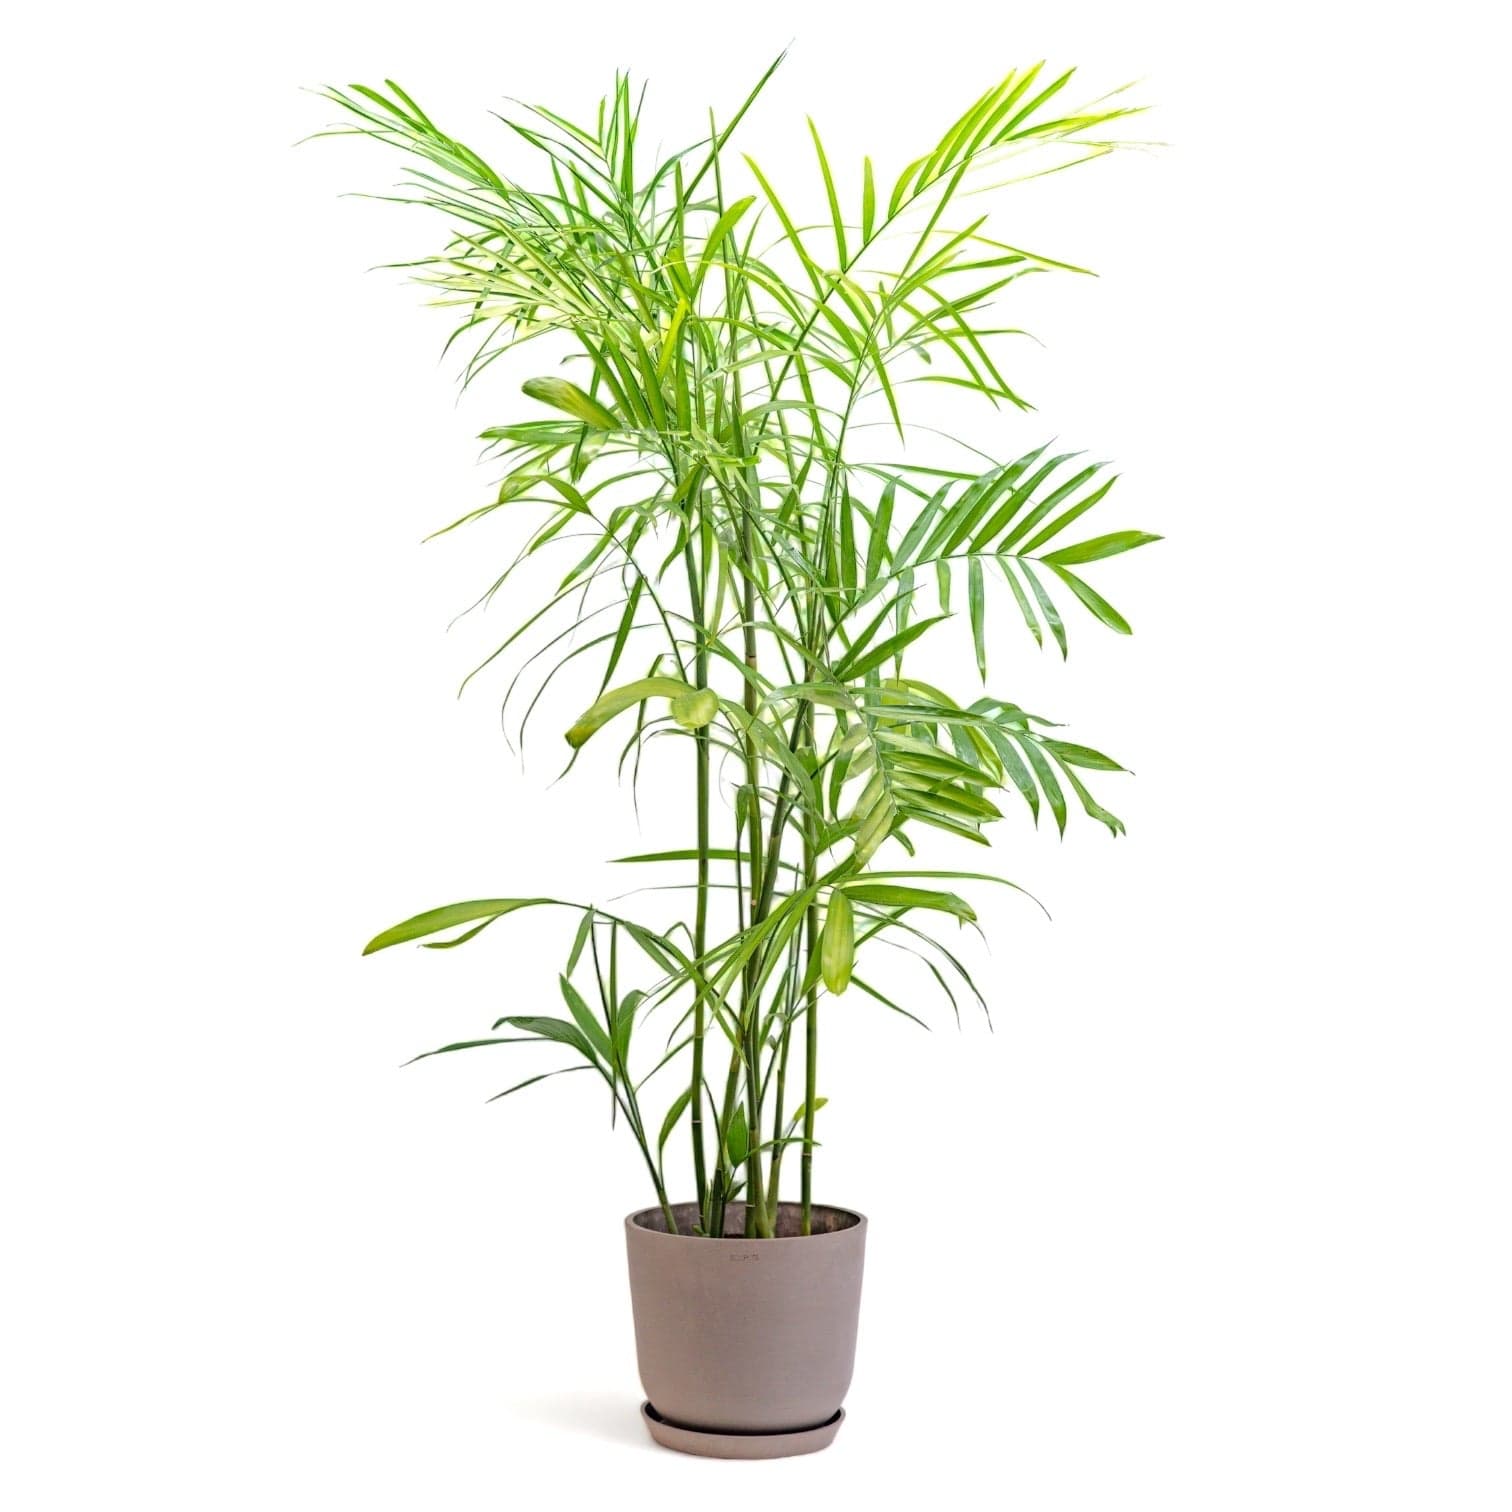
Bamboo Palm

Bamboo Palm

Chamaedorea seifrizii

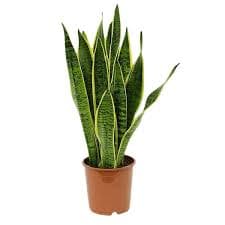
Snake Plant

Snake Plant

Sansevieria trifasciata

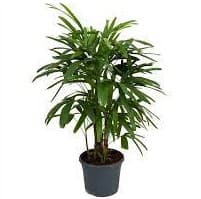
Lady Palm

Lady Palm

Rhapis excelsa

Program leads

Dr. Moeed Yusuf

Dr. Moeed Yusuf

Policy Adviser

A scholar of political science and international relations who has taught at Boston University and LUMS, served as Pakistan’s youngest National Security Adviser, and held senior roles at Harvard’s Kennedy School and the U.S. Institute of Peace. Author of Brokered Bargaining (Stanford, 2018) and currently a Senior Fellow at Harvard’s Belfer Center.

Dr. Usman Nazir

Dr. Usman Nazir

Research Scientist, Group Head

Group head at Beaconhouse National University’s Center for AI Research, working on satellite imagery and remote sensing. Previously at LUMS, Oxford and Leeds on poverty mapping, environmental health and vehicle emissions. Recipient of the Facebook CV4GC award and a Commonwealth Split-Site PhD Scholarship.

Hafiz Muhammad Abubakar

Hafiz Muhammad Abubakar

Associate Researcher, Lead Data Analyst

Works on statistical modelling, geospatial analysis and remote sensing, with publications at NeurIPS, AAAI, ICONIP and IGARSS covering air pollution mapping, flood impact and waste classification. Focused on turning measurement into decisions that hold up in policy.